Ripple Price Augury: XRP’s Price Rose Suddenly- Will it Continue?
- Ripple price augury: A sudden rise in price was seen followed by a short-term downtrend.
- There is one resistance backed by a pattern longer than 1 year. Can it break further?
- The MACD line is well below the signal line which is indicating a weakness. Can it do a crossover?
What is Ripple? A Beginners Guide
Ripple, founded in 2012, is different from other cryptos in the space as it is not decentralized but controlled by one single company. Including this, Ripple wants to be a broker-type currency, which can enable the trade between any assets. Let’s say Bitcoin to USD which is a trade between a Cryptocurrency and Fiat currency. It also has its own token known as XRP. Ripple already operates closely with banks and other financial institutions, which set up a firm base. Establishing a trade network that can allow a good amount of transactions at a fast pace is the goal of Ripple. XRP‘s Previous Action and Forecasting
XRP‘s Previous Price Action
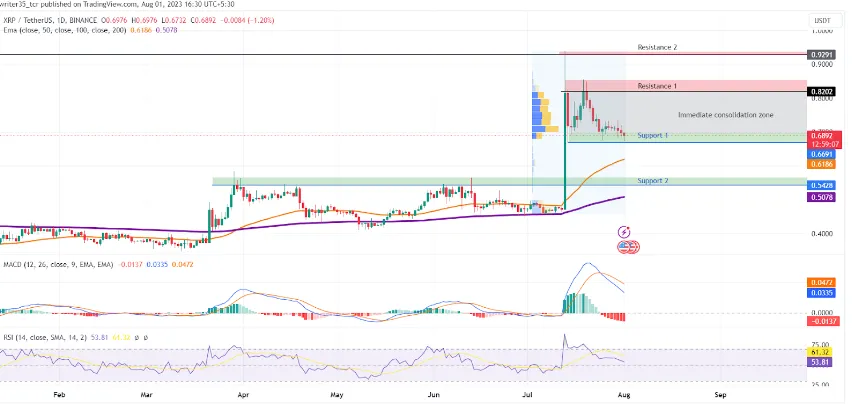
The pricing of XRP has been in consolidation from August 2022 till mid-July 2023 with a cap of $0.5425 and a floor of around $0.32. After the news came out about the coin that it wasn’t a security, the price started booming, breaking all the caps of the previous year.

Chart provided by tradingview.com
Current Price Action and Prediction
Currently, the price is consolidating as the bears realize the price was too high for such a short period. The correction has been seen.
Supports and Resistances: Immediate support is being made at the level of $0.691, which is supported by some volume and some very recent confirmations.
A second support will be made at the level of the broken resistance, $0.5428. This is looking more firm and less likely to be broken in the short term. If the above support breaks, then the price is likely to be consolidating in the zone between $0.69 and $0.54.
The immediate resistance is at the level of $0.828, which is supported by some volume, and has been tested a few times recently. The 2nd resistance is at $0.929, and its confirmation goes back to March 2022.
Indicators
MACD
The MACD line is well below the signal line which is indicating a weakness in the 12 days moving average in comparison with 24 days moving average. The difference between the two is getting wider which indicates a crossover may not come during a near short future.
RSI
The RSI is in the middle at 53, which indicates a sideways market. Not forgetting the fact that it is somewhat of a lagging indicator, it means that it gives the signal later on than the MACD.
The moving averages
The moving averages of the 200 EMA and 50 EMA are well below the price, which is indicating an uptrend in the coin.
Conclusion
Ripple was founded in 2012 and works on a centralized exchange rather than the usual DEX. Ripple wants to be a broker-type currency that can enable the trade between any assets. For example: between a Cryptocurrency and Fiat currency. XRP price saw a sudden rise after positive news came in the market of it not being a security. Currently, a downtrend is seen in the short term.
Technical insights
- Support: $0.690, $0.5428
- Resistance: $0.8202, $0.9291
RSI: 54
50 EMA: $0.6187
200 EMA: $0.5078


