

GameStop Technical Analysis: It follows a Support and Resistance
GameStop Corp. sells multichannel video games, consumer products, and cellular services. It operates in four segments: the United States, Canada, Australia, and Europe. The retail operations and electronic commerce websites www.gamestop.com and www.thinkgeek.com, as well as Game Informer magazine and Kongregate, are all part of the US sector. The retail and e-commerce businesses compose the Canada section. The retail and e-commerce activities in Australia and New Zealand are referred to as the Australian sector.
A short squeeze of the stock of the American video game retailer GameStop (NYSE: GME) and other securities occurred in January 2021, resulting in significant financial ramifications for select hedge funds and big losses for short sellers. Approximately 140 percent of GameStop’s public float had been sold short, and the rush to acquire shares to cover those bets as the price surged drove it even higher.
The Significance of the Stock
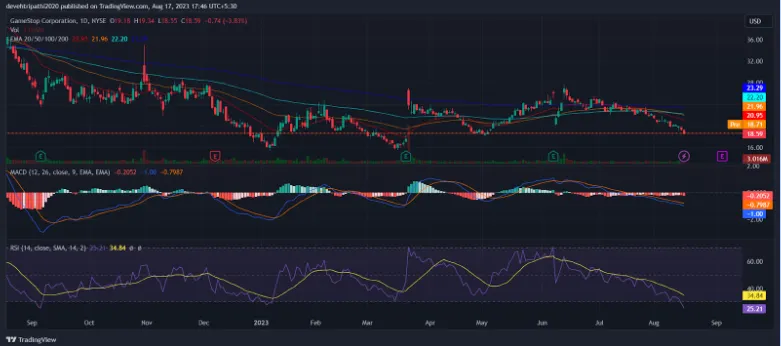
The stock price of GameStop Corp. closed at $18.58, with a total market cap worth $5.66 billion (44 million shares outstanding). GME is the symbol for GameStop Corp. on the New York Stock Exchange. GameStop Corp.’s stock price has risen by -3.91% in the last 24 hours. The stock price prognosis for GameStop Corp. is now positive. The price of GameStop (GME shares) broke down and dropped below the lower trendline of the ascending triangle formation on the charts. GME stock, on the other hand, kept its gains at $20 and tried a rally. According to the charts, the GME stock price has retraced to close the looming gap at $20. If GME stock remains above $20, it may retest the trendline above $25. If it exceeds it in the following sessions, the technicals imply a reversal. However, the trading volume was average, indicating that the stock was being profited.
The price behavior of GME stock demonstrates that it has been stabilizing in a limited range over the last few months, despite favorable feelings. However, buyers attempted to break out of the range, resulting in a false breakout at $28.
What is the thinking before entering the Stock Buy or Sell
The GME stock price has a shaky chart structure. It is fighting to gain ground near the $20 support level. However, the stock has closed the gap and is expected to rebound to maintain the $25 swing. According to the Fib retracement levels, GME stock has fallen from 38.2% to roughly 23.6%, indicating a negative outlook on the daily charts.
Furthermore, the price is close to the lower Bollinger band, indicating selling dominance on the charts. The RSI curve has moved from the overbought to the oversold zone, generating a negative divergence on the charts and signaling selling pressure in recent sessions.
On the Daily Chart:
- The Moving average convergence Divergence (MACD) indicator for GameStop (GME) is -0.91, indicating that GameStop is a Buy.
- GameStop’s (GME) 20-day exponential moving average is 21.20, and the stock price is $18.59, indicating a Sell.
- GameStop’s (GME) 50-day exponential moving average is 22.10, and the stock price is $18.59, indicating a Sell.
On the Weekly Chart:
- The Moving average convergence Divergence (MACD) indicator for GameStop (GME) is -0.56, indicating that GameStop is a Buy.
- GameStop’s (GME) 20-day exponential moving average is 22.13, and the stock price is $18.59, indicating a Sell.
- GameStop’s (GME) 50-day exponential moving average is 23.97, and the stock price is $18.59, indicating a Sell.
Indicators:
- The Relative Strength Index (RSI) for GameStop (GME) is 39.70, indicating a Neutral signal.
- The Trend Strength Indicator (ADX) for GameStop (GME) is 10.00, indicating a Buy signal.
- The Commodity Channel Index (CCI) for GameStop (GME) is -141.79, indicating a Buy signal.
- The Price Rate of Change (ROC) for GameStop (GME) is -9.36, indicating a Sell signal.
The price of GameStop (GME stock) is trading in the demand zone of $20, implying a comeback if held strongly in the region. However, sellers continue to press the bulls and take short positions, resulting in a further drop toward $15. However, the price has fallen below neutrality and is now trading in the selling zone, which may make it difficult for purchasers to recoup their losses.
The Future Scope of the GME
According to our current GME stock estimate, the value of GameStop shares will climb by 3.37% by August 22, 2023, reaching $19.20 per share. Our technical indicators indicate that the present attitude is Bearish, with the Fear and Greed Index reading 39 (Fear). Over the previous 30 days, GME stock had 13/30 (43%) green days and 6.27% price volatility. According to our GameStop stock projection, now is an excellent opportunity to purchase GME stock because it is now trading 3.26% below our forecast. The GameStop stock forecast for 2025 is now 56.08, assuming that GameStop shares will continue to rise at the same average annual rate as they have in the previous ten years. The GME stock price would rise by 201.92% as a result.
If GameStop maintains its current 10-year average growth rate, its shares will be worth $888.32 in 2030. If our GameStop stock forecast for 2030 comes true, GME stock will increase by 4,682.32% from its present price.
Conclusion
The stock has broken a support level and given a negative signal for the long-term trading range. The stock is between support at dollar 16.20 and resistance at dollar 18.50. A definitive breakthrough of one of these levels predicts a new direction.
Technical levels
- Resistance levels: $10.09 and $11.70
- Support levels: $7.50 and $6.50
Disclaimer
The views and opinions stated by the author, or any people named in this article, are for informational purposes only. They do not establish financial, investment, or other advice. Investing in or trading crypto assets comes with a risk of financial loss.


