

ATOM (COINBASE: ATOMUSD) Cosmos Price Evaluation
- ATOM(COSMOS) is a native token or coin of cosmos blockchain. The market capitalization of cosmos is around $590M.
- ATOM started in 2016 but it was launched in April 2019. It was created by Ethan Buchman and Jae Kwon.
- ATOM is used as a voting mechanism in governance. Let’s analyse the price through technical analysis.
The ATOM coin on the line chart is not doing well. At first, it was going up in the direction which also means that it provided good returns to its investors.
After January 2021, it started to retrace and is continuously falling. There were many external reasons for the fall in the price.
Technical Analysis of ATOM(Yearly)
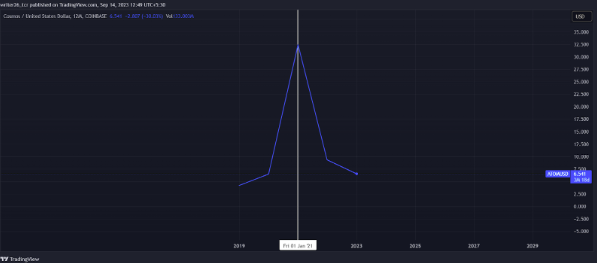
Source: COINBASE: ATOMUSD by Trading View
The chart is divided into two parts. Before Jan 2021, it was doing well but after that it is continuously retracing.
The second part is a reverse copy of the first part only. It was down by (54.04%) last year.
The prediction is not very much clear because the chart in the yearly time is not providing much information.
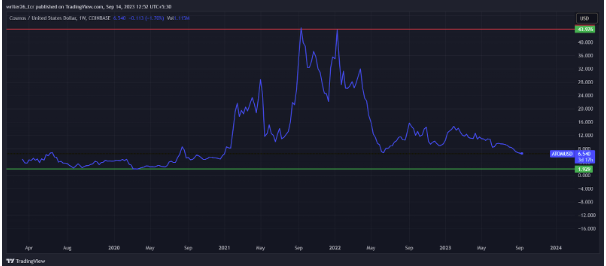
Technical Analysis of ATOM(Monthly)
Source: COINBASE: ATOMUSD by Trading View
The coin took multiple support from the support level. The chances of fall might be possible.
As, it may take another support from the level and starts to move in the upward direction.
Overall, the coin is in a sideways position. It was also down by (22.57%) last month.
The three black crows confirm that the coin may continue its fall in the monthly time frame.
In candlestick charts, it becomes very easy to predict the price with the help of technical patterns and indicators.
The coin is in a bearish trend from January 2021 and the recovery is possible according to the experts.
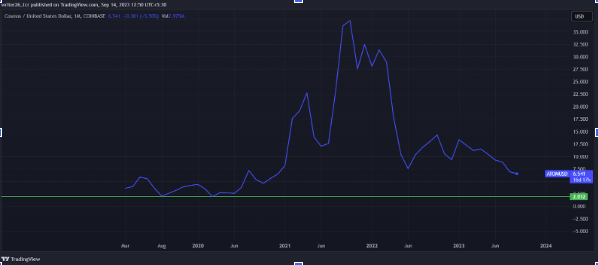
Technical Analysis of ATOM(Weekly)
Source: COINBASE: ATOMUSD by Trading View
The coin is in a range between a support level and a resistance level. In this image it is clear that the coin is the same in all time frames.
It was down by (4.95%) in the last 7 days. Investors are worried as the coin is in bearish momentum.
Experts are backing up the coin and waiting for the rally to break the resistance level near $8.00.
The coin is continuously forming three black crows patterns which means it will continue its rally in the downward direction.
Technical Analysis of ATOM(Daily)
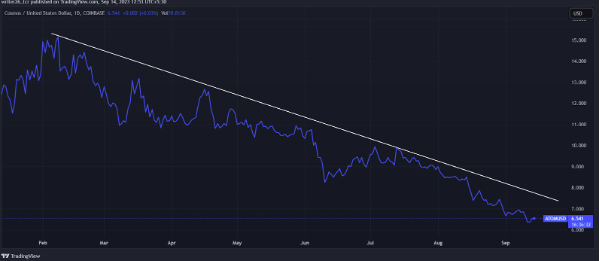
Source: COINBASE: ATOMUSD Trading View
In the daily time frame, the coin is in downtrend. It was up by 1.88% which is a good and positive sign for the coin.
The coin is under the control of bears and may fall by (3.29%) and may reach $6.32 by 18th September 2023.
The morning star pattern appears in a downtrend. It indicates that the coin might move in the up direction. The price volatility is around 6.51% over the last 30 days.
F&G Index(Fear and Greed Index) is showing 45(fear). The coin recorded 15/30 days green which is around 50% in the last 30 days.
Summary
Through the technical analysis we can conclude that the coin is not performing well in the weekly and daily time frame.
In the daily time frame, it is a sideways position. In the weekly time frame, according to candlestick it may move lower in the future.
In the monthly and yearly time frame, the coin is not doing well.
Crypto investors should have proper knowledge about the cryptocurrency market.
Technical levels
Resistance Level- $13.773
Support Level- $11.150
Disclaimer
The views and opinions stated by the author, or any people named in this article, are for informational purposes only. They do not establish financial, investment, or any other advice. Investing in or trading stocks comes with the risk of financial loss.


