

SBUX Stock Can Again Hit Swing Lows, What Should Be Action Plan?
- SBUX stock is making bearish patterns on the technical charts.
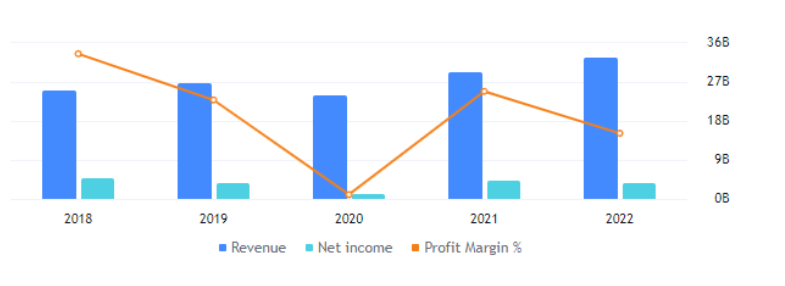
- The revenue of the Starbucks Corporation has been advancing constantly for the last three years.
Starbucks is a consumer services sector company and works in the restaurant industry. It is an American multinational chain of coffee houses and roastery reserves. It is world’s one of the most well-known and largest companies that promoted coffee culture and coffee beverages. The current CEO of the company is Laxman Narasimhan and has its headquarters in Seattle.
The Starbucks Corporation’s stock is traded as SBUX on the NASDAQ exchange. The beta of the SBUX stock is 0.81 which indicates that the share price of the company is less volatile and its returns are more stable than the overall market.
The current EPS of the company is 3.30 USD which represents the amount of money Starbucks Corporation is making on each share. The price-to-earnings ratio of the company is also very good resulting in 28.62.
Starbucks Corporation also gives dividends to its shareholders and paid a total dividend of $1.96 in the year 2022. The company has consistently advanced its dividend when compared to the previous years. The dividend yield on the SBUX stock for the year 2022 is 2.33%.
Financial Performance For SBUX Stock
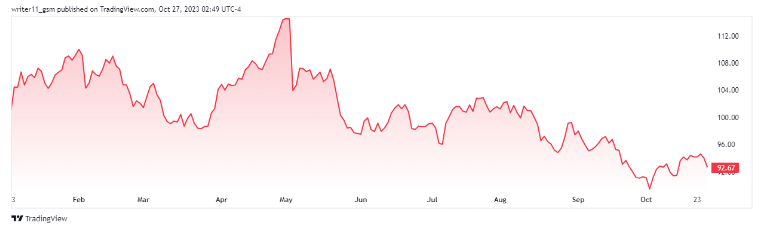
Source: Tradingview
Starbucks Corporation ended up with a debt of $23.80B in the year ending 2022. Also, the free cash flow for the year throughout the year has been $2.56B. This is further followed by a net income of $3.28B resulting in a profit margin of 10.18%. The cost of selling goods incurred by the company is $25.919B which is a major chunk of the revenue. This shows that the expenses of the company are high.
SBUX Stock Forms Bearish Price Action With Decline In The Stock Price
After hitting a most significant swing high price of $115.48 the SBUX stock gave a gap down of 4%. Since then the stock price has started to follow the downtrend and has continued its downward journey till now.
The consistent declining behavior of the SBUX stock price has led to the formation of a falling wedge pattern. The share price of SBUX is still trading inside the pattern indicating bearishness.
Following the most recent price action the stock price has broken down below the most recent consolidation. The SBUX stock has formed a strong bearish candle indicating the dominance of sellers in the chart.
The EMAs like the 50-day and the 200-day EMA are following a downtrend. They are trading in a bearish death cross which indicates a downtrend in the stock price.
The RSI for the SBUX stock also tried to break above the 50-level but failed and reversed above the 50 zone. Currently, the RSI for the stock on the daily timeframe is trading at a level of 44.73.
Conclusion
Based upon the current scenario the SBUX stock’s technicals seem more dominating in the price rather than its financials. Thus, the SBUX share price can lead to further lower levels in the upcoming days and may can hit the lower band of the wedge pattern.
Technical Levels
- Support levels– $83.60 and $89.40
- Resistance levels– $103.00 and $109.60
Disclaimer
The information provided in this article, including the views and opinions expressed by the author or any individuals mentioned, is intended for informational purposes only. It is important to note that the article does not provide financial or investment advice. Investing or trading in cryptocurrency assets carries inherent risks and can result in financial loss.


