

Avacta Group plc Share Price: Since 2023, it has been bearish.
- Forecasted revenue growth is 17.8% annually.
- Over the next three years, earnings are expected to decrease by an average of 4.4% annually.
- In the last year, the share price of Avacta Group PLC ranged from 87.99p to 187.98p.
Anglo American PLC’s annual revenues decreased by -15.49% from 41.55 billion to 35.12 billion. The result was a decline in net income from $8.56 billion to $4.51 billion, a loss of -47.28%, combined with an increase in the cost of goods sold expense. Cash on hand at Anglo American PLC decreased by $657.00 million in 2022. However, the business generated $9.77 billion in revenue from operations, yielding a cash flow margin of 27.81%. Dividends per share and profit per share growth excluding exceptional items declined by -57.09% and -46.20%, respectively, year over year. There are 279,323,300 shares of Avacta Group PLC outstanding. In its most recent earnings release, Avacta Group PLC revealed EPS of -0.116p, falling short of analysts’ forecasts of -0.051p. The stock price decreased by 2.529% after the results announcement. For the daily chart, the day’s range is 98.75 to 98.75, the 52-week range is 87.99 to 187.98, and the previous close is 102.00 points, while the open is 99.00. Volume is 232,248 and the average volume over three months is 1,031,900; the 1-Year Change is -12.94%.
What does the Bearish Trend Line Speaks?
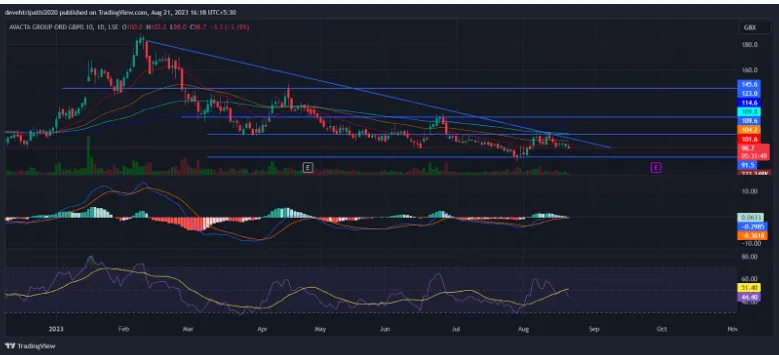
Avacta’s Moving Averages Convergence Divergence (MACD) indicator is at -0.03, indicating a sell, while Avacta’s 20-day Exponential Moving Average is at 101.94, making it a buy, and Avacta’s 50-day Exponential Moving Average is at 104.45, indicating a sell, with the share price at 102p.
Avacta Trend Strength Indicator (ADX) is 12.17, providing a Buy signal, while Avacta Relative Strength Index (RSI) is 49.63, creating a Neutral signal. Avacta’s Price Rate of Change (ROC) is 8.51 and Avacta’s Commodity Channel Index (CCI) is 0.30, generating Buy and Neutral signals, respectively. The 50-day moving average for AVCT is 103.86, indicating that the stock is a Sell. The 200-day moving average for AVCT is 121.40, indicating that the stock is a Sell. From February 2023, the AVCT is a sideways bearish stock with sporadic peaks. There is a pattern known as the Bullish Pennant Pattern, and because they take a 3 resistance, it is probable that it may reach high in certain months. The EMA also indicates that AVCT is bearish because all the EMA are very up to the market prices. So we should play bearish in the market.
The Support And Resistance Game
Avacta Group Plc shows weak development in a falling trend channel in the medium and long term. This weakens the falling trend and could be an early signal of a coming trend break. In case of negative reactions, there will now be support at pence 100. Volume tops and volume bottoms correspond well with tops and bottoms in the price.
Conclusion
It is not expected to become profitable during the following three years and is not already profitable. Falling trends indicate that the company experiences negative development and falling buy interest among investors. The stock has broken up through resistance at pence 100. This predicts a further rise.
Technical Level
- Support: 91 point
- Resistance: 104 point
Disclaimer
The views and opinions stated by the author, or any people named in this article, are for informational purposes only. They do not establish financial, investment, or other advice. Investing in or trading crypto assets comes with a risk of financial loss.


