Binance Coin Price Analysis: Will BNB Move Out of Range?
- Binance Coin (BNB) is currently trading at $240.11 with a rise of -3.11% in 24 hours.
- Binance Coin (BNB)’s live market cap is $37,414,828,180.
- Binance Coin (BNB)’s 24-hour volume is $462,604,901 which rose by -22.40% in 24 hour
One of the biggest cryptocurrency exchanges in the world, Binance, developed the Binance Smart Chain (BSC), a blockchain platform on which Binance Coin (BNB) runs. The Binance ecosystem’s native cryptocurrency is BNB.
BNB is used in a variety of ways.
- It can be used to cover trading commissions on the Binance exchange.
- Take part in token sales on the Binance Launchpad, and
- Gain access to several decentralized finance (DeFi) services made possible by the Binance Smart Chain.
- Additionally, through the Binance Coin Binance Smart Chain (BCB) ecosystem, BNB is used for staking and taking part in Binance’s decentralized governance.
Trend Analysis
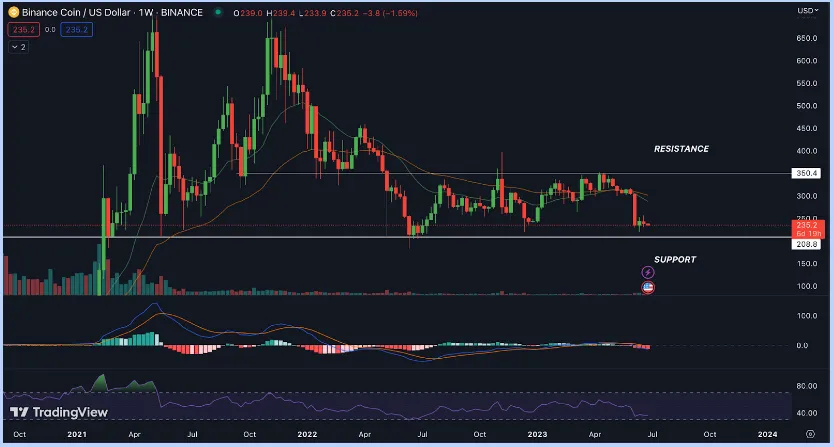
Since its debut, Binance Coin has shown a sizable long-term upward tendency. The price of BNB has increased steadily over time. But currently, BNB is in downtrend momentum and forming a horizontal channel pattern which means the price is moving in a channel.
The price of Binance Coin (BNB) has dropped by 28.11% during the past three days, showing that it is currently performing poorly. Nearly two years ago, Binance Coin (BNB) reached its high price of $703.12; since then, it has fallen by -70.08%. As is acknowledged, there is currently low volume available in the coin, indicating that there aren’t enough buyers because of the negative market sentiments.
Binance Coin (BNB) Price Analysis

Source: BNB/USD.1D.BINANCE by TradingView
EMA
The price of Binance Coin (BNB) is currently trading below the 20–50 day EMA daily, which is not good. The price of Binance Coin (BNB) is experiencing bearish momentum, and the sentiment of sell-side investors may change in the future.
MACD
The MACD indicator helps identify emerging trends, market conditions that are bullish or bearish, and changes in momentum. The chart consists of the MACD line, the signal line, and a histogram that displays the deviation between the two lines.
A bearish signal is currently being given by Binance Coin’s MACD line, which is currently trading below the daily period’s signal line. Histograms in red show increasing bearish momentum. This suggests that Binance Coin’s price could fall even lower shortly.
RSI
The RSI, a momentum oscillator, measures how rapidly and severely prices change. Between 0 and 100, it swings, with values over 70 suggesting overbought situations and under 30 indicating oversold areas. The current value of RSI is 37.66 and the 14 SMA line below the median line is near 50.89 which is indicating bearish momentum in the market.
Volume Analysis
The Binance Coin (BNB) 24-hour trading volume is $462,604,901 with an increase of -22.40%, indicating a decrease in market activity.
Technical Levels:
- Support – The current support level of the Binance Coin (BNB) is $14.9010.
- Resistance -The current resistance level of the Binance Coin (BNB) is $19.0789.
Conclusion
According to the technical indicators for the weekly time frame, Binance Coin (BNB) is currently flashing a bearish signal. According to the MACD, negative crossover is generated and RSI also indicates negative signals. The price of Binance Coin (BNB) at this time indicates uncertainty for the immediate future, and the EMA analysis indicates that the short-term trend is negative.
Disclaimer
The views and opinions of the author, or anyone named in this article, are for informational purposes only. They do not offer financial, investment, or other advice. Investing or trading crypto assets involves the risk of financial loss.


